
Interactive Power BI Demo
Power BI Demo: Explore Live Dashboard Examples
Explore six interactive Power BI reports covering finance, sales, accounts receivable, accounts payable and supply chain operations. Open the dashboards, explore the available views, and see how business data can support better decisions.
Each report opens in Power BI in a new browser tab.
MODEL
- ERPSAP · Dynamics · Oracle · NetSuite
- CRMSalesforce · HubSpot · Dynamics
- DATABASESSQL Server · Postgres · Snowflake
- FILESExcel · CSV · SharePoint
- CLOUDAzure · AWS · GCP · Fabric
- APIs & APPSREST · SOAP · OData · Custom
MODEL
- Dashboards
- KPIs
- Reports
- Insights
- Business Decisions
Power BI Report Gallery
Explore Our Interactive Power BI Reports
Filter by business area or search by name, then open any report to work with it directly in Power BI.
Showing all 6 reports
-
 Finance
LIVE
Finance
LIVE
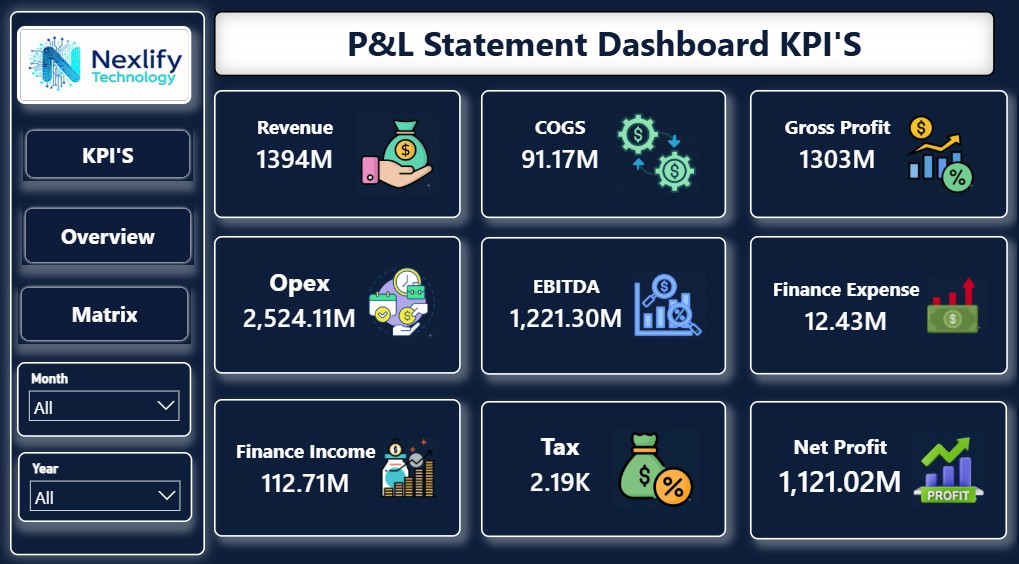
P&L Dashboard (GL)
General ledger balances, journal activity and account-level drill-down across ledgers.
-
 Finance
LIVE
Finance
LIVE
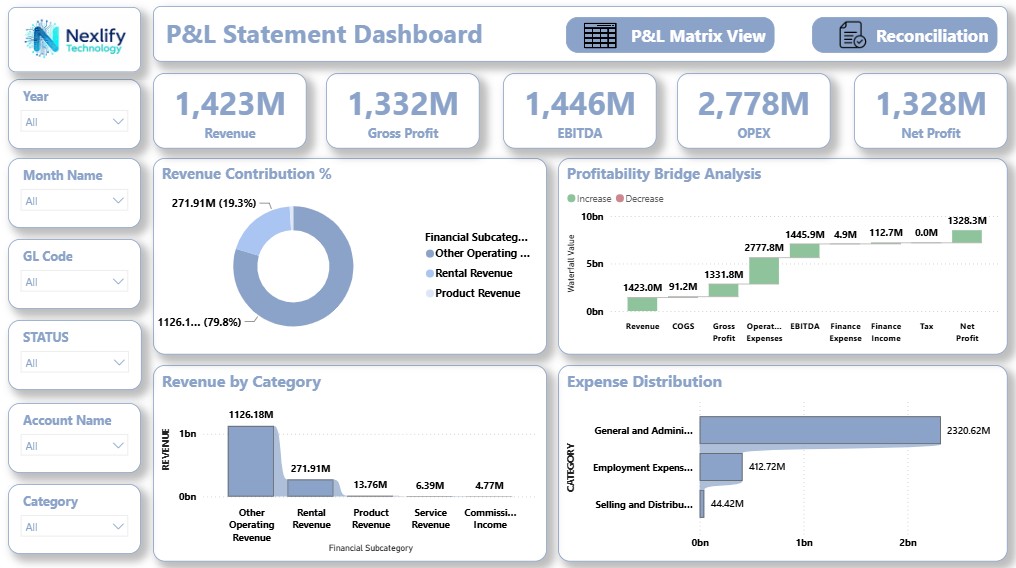
P&L Statement Dashboard
Formal profit and loss statement view formatted for finance leadership reporting.
-
 Supply Chain Management
LIVE
Supply Chain Management
LIVE
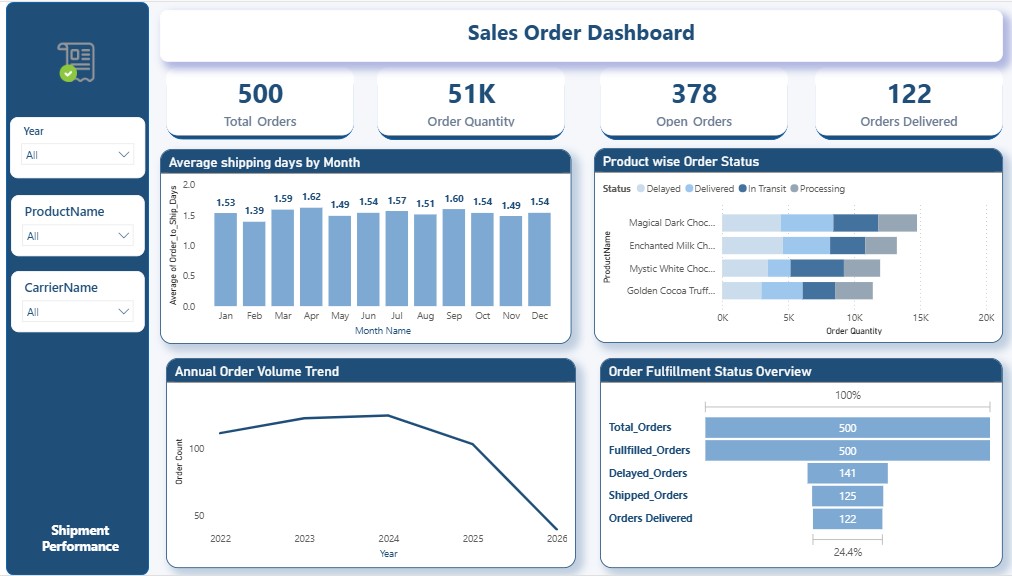
Sales Order Dashboard
Open, fulfilled and backlogged sales orders with status and fulfillment tracking.
-
 Supply Chain Management
LIVE
Supply Chain Management
LIVE
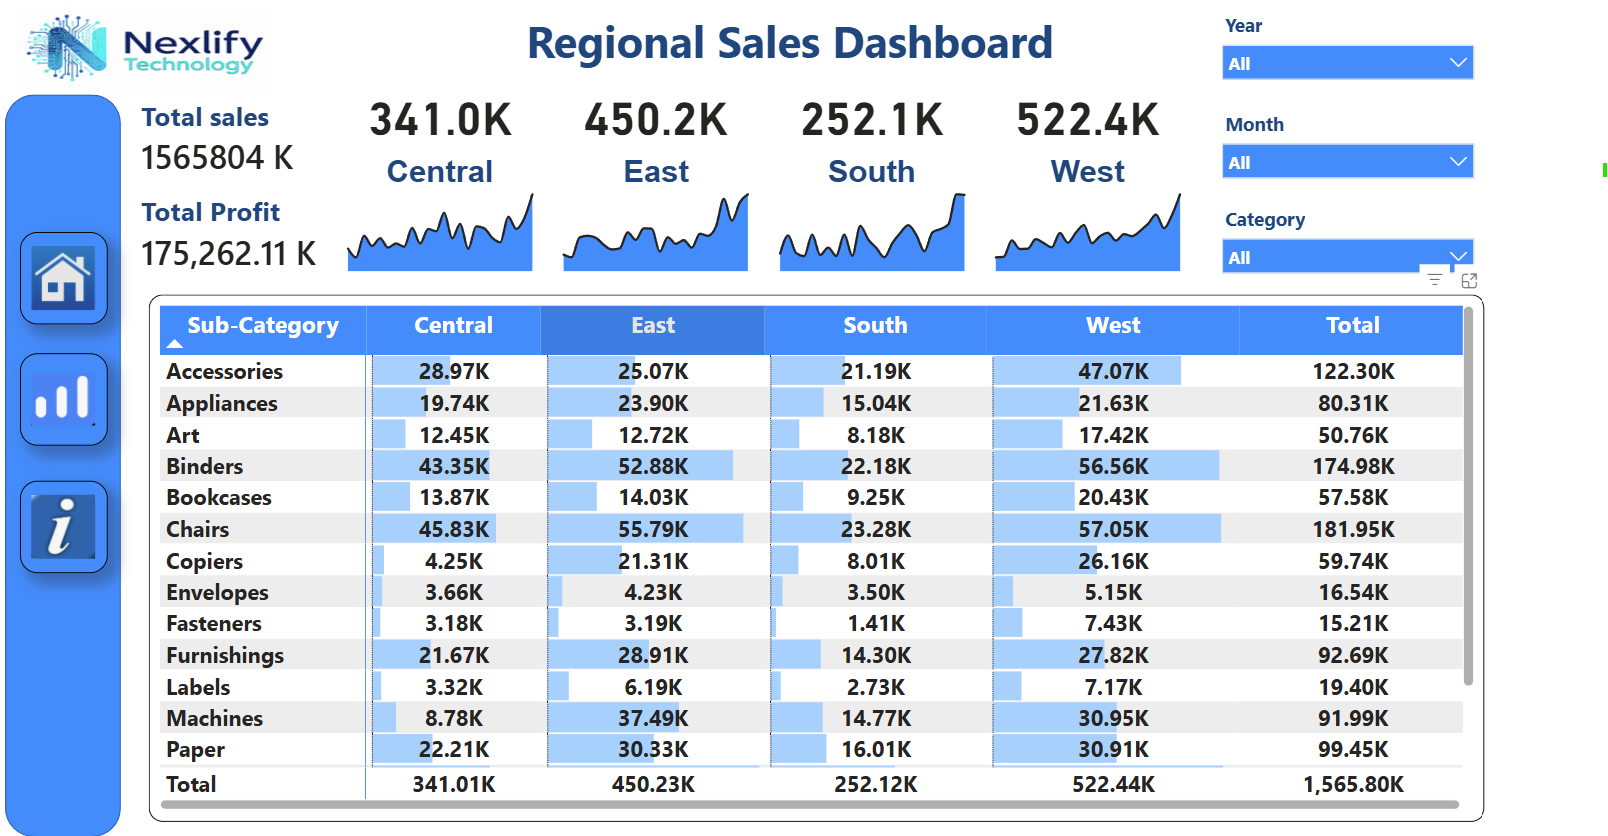
Regional Sales Dashboard
Regional and sub-category sales performance with total sales and profit trends across territories.
-
 Finance
LIVE
Finance
LIVE
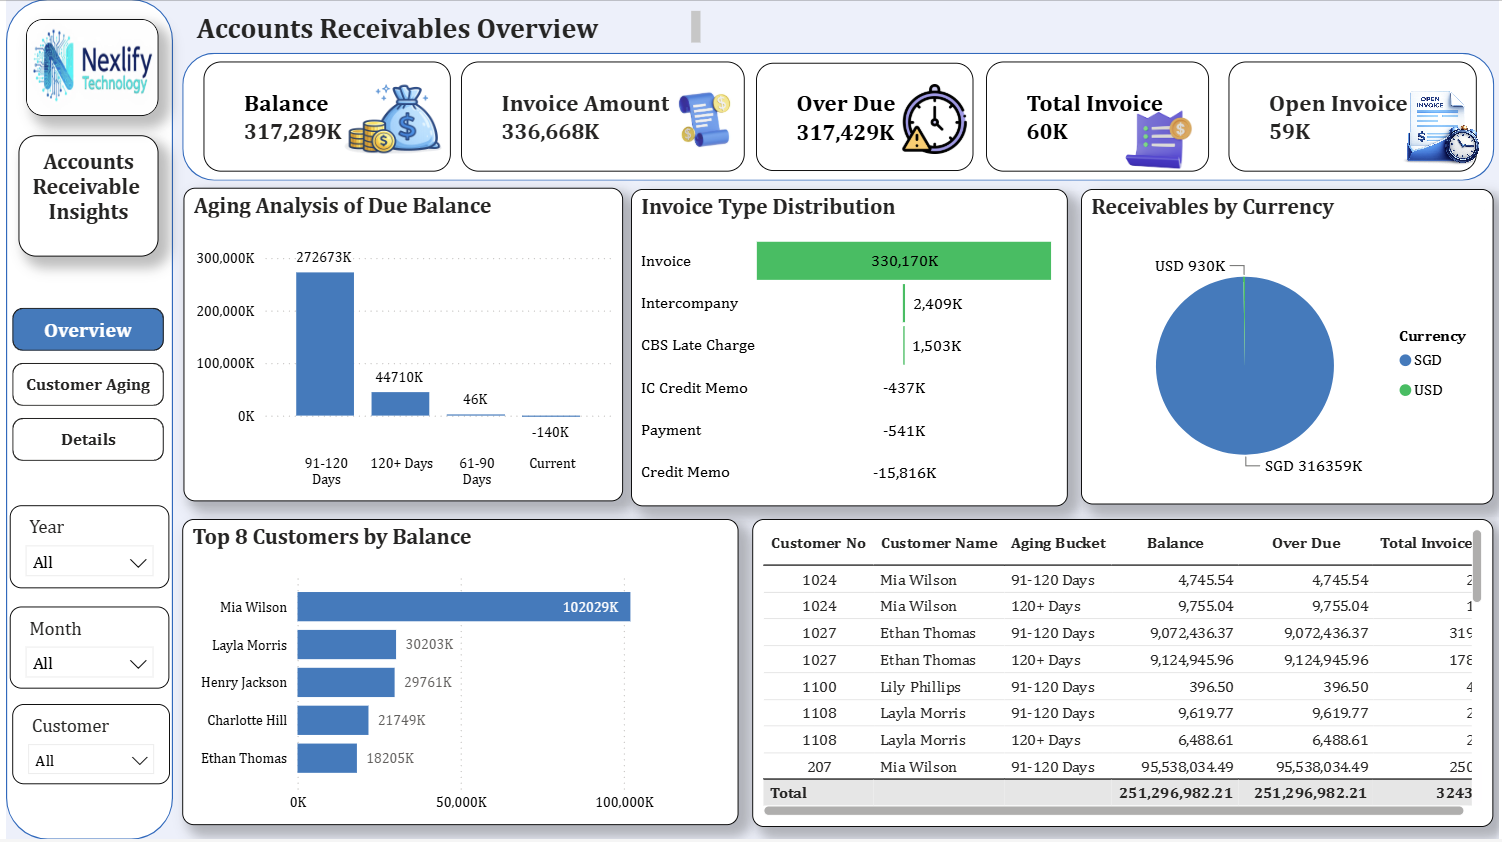
Accounts Receivable Overview
AR aging analysis, invoice type distribution and top customer balances with multi-currency receivables tracking.
-
 Finance
LIVE
Finance
LIVE
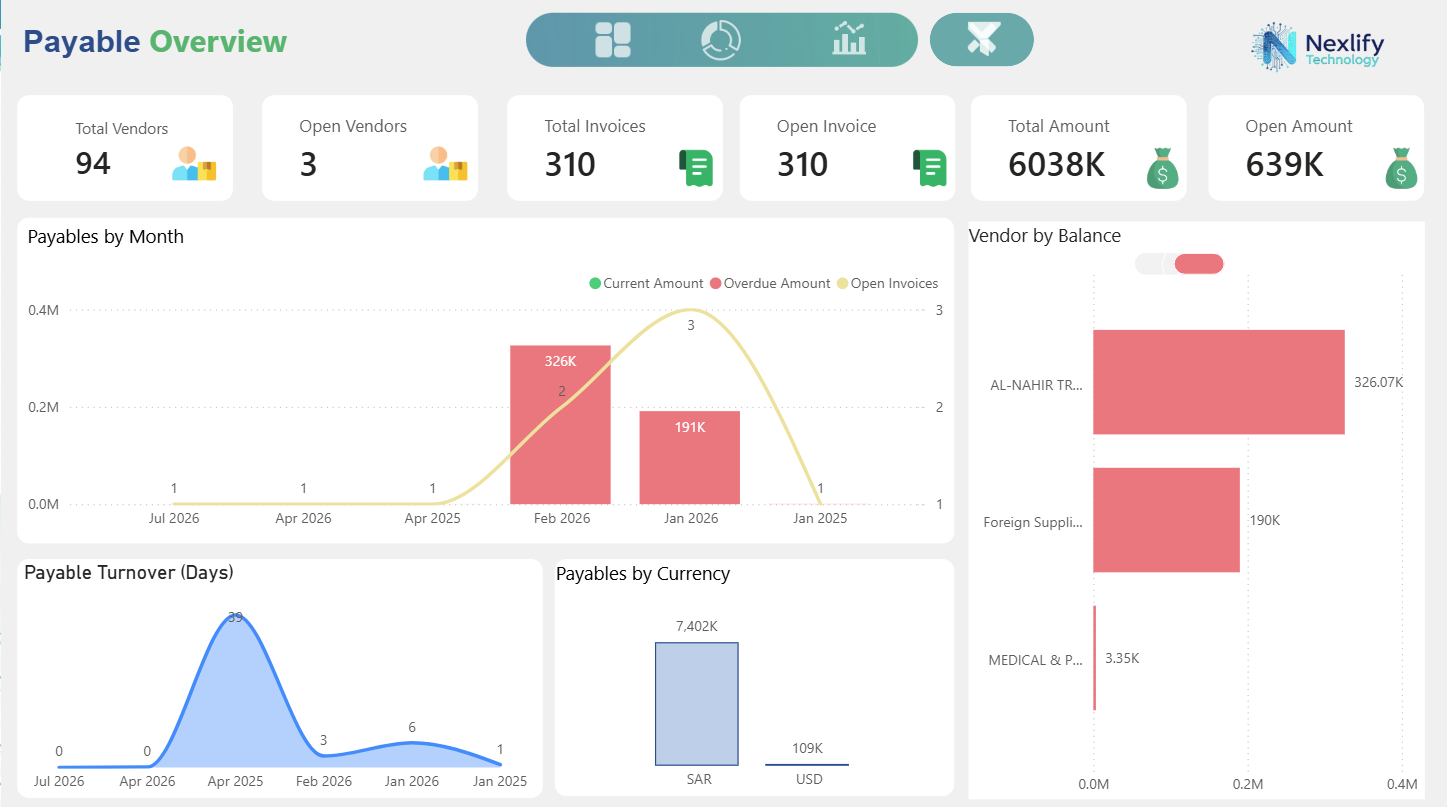
Accounts Payable Dashboard
Accounts payable aging, vendor balances and payable turnover with open invoice tracking across currencies.
No reports match "" in .
Dashboard Business Value
See What Power BI Dashboards Can Help You Understand
-
Finance
Are we more or less profitable than last period, and which accounts or cost lines are behind the change?
-
Accounts Receivable
Which customers owe the most, how long have their invoices been open, and where should collections start first?
-
Accounts Payable
What do we owe suppliers, what falls due in the coming weeks, and are any invoices already overdue?
-
Sales
Which regions and product groups are growing or slipping, and is profit keeping pace with revenue?
-
Supply Chain
How many orders are still waiting to be fulfilled, and where is the backlog starting to build up?
-
Executive Reporting
How is the business performing across finance, sales and operations, and which numbers need attention at the next review?
Want a dashboard like this for your business?
Request a Dashboard ConsultationBusiness Domains
Power BI Solutions for Every Business Function
Your business is unique. Your reporting should be too.
Instead of forcing your processes into a predefined template, we design each solution around your workflows, reporting requirements and KPIs, whether you need a single departmental report or a set of connected dashboards across the organization.
- Finance & Accounting
- Accounts Receivable
- Accounts Payable
- General Ledger
- Procurement
- Supply Chain
- Sales & Operations
- Inventory
- HCM / HR
- Management Reporting
- Executive Dashboards
Our Services
What Can Nexlify Help You With?
From the first data connection to long-term reporting support, we cover each stage of a business intelligence project.
-
Dashboard & Report Development
Interactive dashboards and reports designed around the metrics your teams use to make decisions.
-
Data Modeling & DAX
Well-structured data models and DAX measures that keep calculations consistent across every report.
-
Data Integration
Bring ERP, CRM, database, spreadsheet and cloud data together into a single reporting model.
-
KPI Development
Define and calculate the KPIs leadership needs, with clear business logic behind each number.
-
Report Migration
Move Excel reports, Oracle OTBI and BI Publisher reports, or dashboards from other BI tools into Power BI.
-
Automated Reporting
Scheduled data refresh so reports stay current without manual exports or copy-and-paste work.
-
Dashboard Optimization
Speed up slow or hard-to-use reports through better data models, measures and visual design.
-
BI Consulting & Roadmaps
Practical advice on reporting priorities, workspace setup and a phased plan for your analytics.
-
Training & Handover
Walkthroughs and hands-on training so your team can use and maintain dashboards with confidence.
Data Sources
Connect the Systems You Already Use
Most businesses keep data in several places. Your reporting should bring it together.
We connect Power BI to ERP, CRM, database, spreadsheet and cloud sources, then combine them into one data model. For Oracle Fusion, for example, we work with BI Publisher, OTBI and REST APIs; for other platforms we use the connection method that best suits the system and your security requirements.
Using a system that isn't listed here? Tell us about your data sources and we will confirm connectivity during discovery.
- Oracle Fusion Cloud
- SAP
- Salesforce
- Relational databases
- Oracle Autonomous Database (ATP)
- Excel files
- Cloud data sources
- REST APIs
Free Pilot
Start With a Free 2-Week Power BI Pilot
Not sure what your reporting solution should look like? The pilot lets you see your own data in a working dashboard before you commit to a larger engagement.
-
01
Discover
We review your reporting requirements, business processes and KPIs, and agree on the scope.
-
02
Connect
We connect one agreed business data source and prepare the data for reporting.
-
03
Build
We develop a working dashboard based on the KPIs and requirements agreed in discovery.
-
04
Review
We walk you through the dashboard and outline next steps for a production rollout.
What you receive during the pilot
- A discovery session to agree on KPIs and one data source
- A working dashboard built on your own data
- A review walkthrough of the dashboard and data model
- Recommended scope and next steps for production
- No cost and no obligation to continue
Pilot scope is agreed during discovery and depends on timely access to the selected data source.
A focused first step before moving into a larger BI engagement.
Engagement Options
Power BI Services Pricing
Start with a free pilot, then choose the engagement model that fits your workload, from occasional development hours to ongoing business intelligence support.
2-Week Pilot
Free / 2 weeks
Best for
Businesses that want to see their own data in a working dashboard before committing to a paid engagement.
- Discovery session
- One agreed data source
- Working dashboard on your data
- KPIs you select
- Review and next-step plan
- No obligation to continue
Hourly Engagement
$16 / hour
Best for
Ad-hoc dashboard changes, fixes and short technical tasks where you pay only for the hours used.
- Dashboard development
- DAX measures
- Data modeling
- Report enhancements
- Visualization improvements
- Technical support
Popular
Monthly Engagement
$1,800 / month
Best for
Teams that need ongoing dashboard development and reporting support every month.
- Continuous development
- New dashboards and reports
- DAX & KPI development
- Data modeling
- Report enhancements
- Technical support
- BI consultation
6-Month Engagement
Custom Pricing
Best for
Organizations planning several dashboards, data integration and regular optimization over a defined period.
- Dedicated BI support
- Multiple dashboard development
- Data integration support
- DAX & data modeling
- Dashboard optimization
- Regular reporting enhancements
- Long-term BI support
6-month engagements are priced according to scope, the number of dashboards and data sources, and the level of support required.
Why Nexlify
Why Choose Nexlify for Power BI?
-
01
Enterprise Technology Expertise
Experience across Oracle Fusion, OCI, Power BI and cloud technologies.
-
02
End-to-End BI Delivery
From source-system integration to data modeling and visualization.
-
03
Business-Focused Dashboards
Reports designed around real KPIs and the decisions they support.
-
04
Flexible Engagement Models
Hourly, monthly and long-term options to match your workload.
-
05
Free 2-Week Pilot
See the approach on your own data before starting a larger engagement.
Common Questions
Power BI Services FAQs
Answers to the questions we hear most from businesses planning a Power BI project.
Services and data sources
What Power BI services does Nexlify provide?+
Nexlify provides Power BI consulting and development, including dashboard and report development, data modeling and DAX, data integration, KPI development, report migration, dashboard optimization, scheduled refresh setup, training and ongoing support. Work is available hourly, monthly or through a 6-month engagement, and you can start with a free 2-week pilot.
Can Power BI connect to Oracle Fusion, SAP, Salesforce and other data sources?+
Yes. We have hands-on experience connecting Power BI to Oracle Fusion (through BI Publisher, OTBI and REST APIs), SAP and Salesforce, as well as databases, Excel files and cloud data sources. We confirm the most suitable connection method for your systems during discovery.
Can you migrate Excel reports or dashboards from another BI tool to Power BI?+
Yes. We migrate Excel reports, Oracle OTBI and BI Publisher reports, and dashboards from other BI tools into Power BI. We keep the business logic your team already relies on while improving performance and usability.
How often can Power BI dashboards refresh with new data?+
It depends on your data source and licensing. Power BI Pro supports up to 8 scheduled refreshes per day, and Premium or Fabric capacity supports up to 48. For near real-time reporting, DirectQuery can be used with supported sources. We recommend a schedule based on how time-sensitive each KPI is.
Pilot, timelines and support
How long does it take to build a Power BI dashboard?+
The free pilot delivers a working dashboard on one data source in two weeks. A production rollout across several business areas usually takes 4 to 8 weeks, depending on data complexity and the number of reports required.
What is included in the free 2-week Power BI pilot?+
The pilot includes a discovery session, a connection to one agreed data source, a working dashboard built around the KPIs you select, and a review session with recommended next steps. There is no cost and no obligation to continue.
Do you provide ongoing Power BI support after the dashboard is delivered?+
Yes. All engagement options include technical support. Monthly and 6-month plans also cover ongoing enhancements, new reports and BI consultation as your requirements change.
Do you provide Power BI training for our team?+
Yes. Every engagement includes a walkthrough and handover session. We can also provide more detailed hands-on training so your internal team can use and maintain the dashboards independently.
Licensing, security and working together
Do I need my own Power BI license?+
Usually, yes. We typically build inside your own Power BI tenant so your organization keeps full ownership of the workspace, licenses and data. If you do not have a tenant yet, we can guide you through the setup.
Can our team view dashboards on mobile devices?+
Yes. Published dashboards can be viewed in a web browser and in the Power BI mobile apps. Where needed, we design mobile layouts for the report pages your team checks most often.
Is our business data kept secure and confidential?+
Yes. We work only with the data sources and access levels you approve, follow your organization's security requirements, and can work entirely within your own Power BI and cloud environment. We can also sign an NDA before any work begins.
Do I need a long-term contract to get started?+
No. You can start with the free pilot or hourly support and move to a monthly or 6-month engagement only when you are ready.
Do you work with businesses outside India?+
Yes. We work with clients in the UAE, Qatar and other countries. Communication happens over email, calls and video meetings scheduled around your time zone, with regular progress updates.
Ready to Turn Your Business Data Into Actionable Insights?
Start with a free 2-week pilot on your own data, or talk to our team about a larger reporting and analytics project.