
Introduction to Accounts Receivable Analytics
Accounts Receivable (AR) is one of the most important areas of financial operations because it directly affects an organization's cash flow and working capital. Every day, finance teams manage customer invoices, payments, credit terms, outstanding balances, due dates, and overdue receivables. When this information is spread across ERP reports and spreadsheets, it becomes difficult to understand the current collection position and identify invoices that need immediate attention.
This is where Power BI makes a significant difference — but only when it is fed by a reliable, well-architected data pipeline.
For this Accounts Receivable Dashboard, the financial data originates in Oracle Fusion. Rather than connecting Power BI directly to Fusion, the data is first moved through Oracle Integration Cloud (OIC) into an Oracle Autonomous Transaction Processing (ATP) database, which then serves as the reporting layer that Power BI connects to. This three-tier approach — Fusion as the system of record, OIC as the integration layer, and ATP as the reporting database — keeps the dashboard fast, secure, and easy to maintain across environments.
The goal isn't simply to display financial information — it's to help AR teams answer the questions they ask every day, in seconds instead of hours.
The goal of the dashboard is not simply to display financial information. It is designed to help Accounts Receivable teams answer important business questions quickly:
- How much money is currently outstanding?
- How much of the outstanding balance is overdue?
- Which invoices require immediate collection action?
- Which customers have the highest outstanding balances?
- How is receivables performance changing over time?
- Which aging buckets contain the largest amount of outstanding debt?
By bringing these insights together in Power BI, finance teams spend less time preparing reports and more time managing collections and improving cash flow.
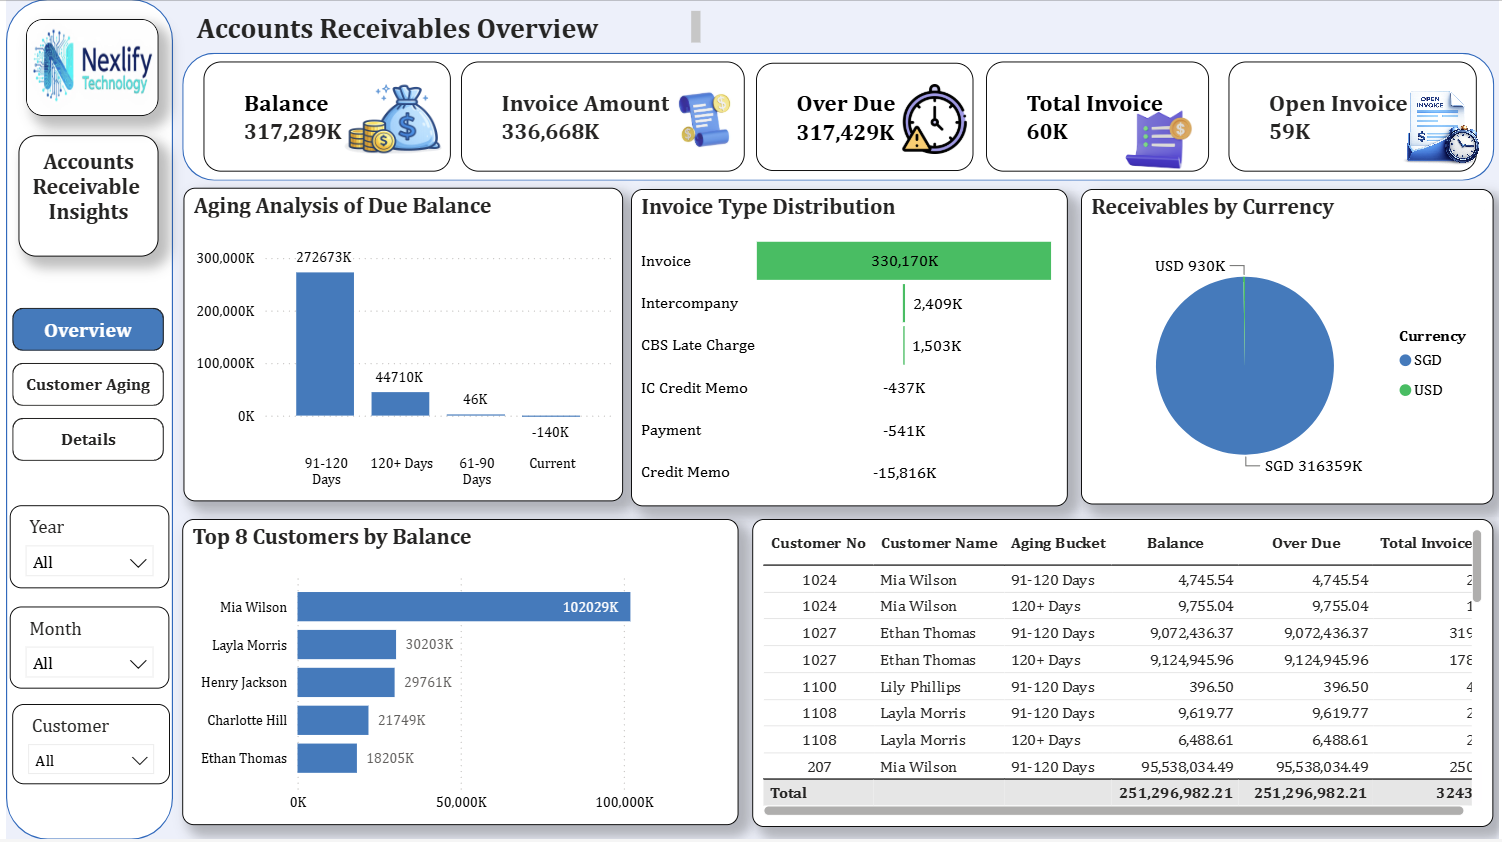
Dashboard Walkthrough
Why Accounts Receivable Teams Need an Effective Power BI Dashboard
AR teams often work with a large number of invoices and customer transactions. Reviewing each invoice individually can take considerable time, particularly when the organization operates across multiple customers, business units, currencies, and payment terms.
Traditional Excel-based reporting introduces its own challenges. Data has to be exported manually, different spreadsheets end up with different versions of the same numbers, and formulas need to be rebuilt every reporting cycle.
A Power BI Accounts Receivable Dashboard replaces this with a single, centralized view of the receivables position — fed automatically from Oracle Fusion via OIC and ATP, with connection details managed through environment configuration so the same dashboard logic works across development, testing, and production.
The biggest advantage is interactive analysis. Finance users can filter by invoice date, customer, currency, payment terms, or invoice type, and drill from a total outstanding figure down to a specific customer, invoice, or aging category — without generating a new report each time.
Connecting Oracle Fusion to Power BI: The Role of OIC and ATP
A reliable data pipeline is the foundation of any AR reporting solution. In this architecture, Oracle Fusion remains the system of record, but Power BI never connects to it directly. Instead, Oracle Integration Cloud (OIC) sits between the two systems and does the heavy lifting.
OIC connects to Oracle Fusion using its BI Publisher (BIP) reports and REST/SOAP web services to extract Accounts Receivable data — invoices, outstanding balances, due dates, customers, currencies, and payment terms. It then transforms and loads that data into Oracle ATP, where it lands in tables designed specifically for reporting rather than transaction processing.
This matters for two reasons. First, it protects the Fusion environment from the query load that a live BI tool would otherwise generate. Second, it gives the reporting layer its own schema, refresh cadence, and performance characteristics, independent of Fusion's transactional workload.
Once the AR data is available in ATP, Power BI connects to it securely using the ATP wallet. The wallet.zip file is placed under the network/admin folder, the Oracle Instant Client is installed, and the client and wallet locations are added to the PATH environment variable. Power BI Desktop then uses the Oracle Database connector to import data directly from ATP.
Keeping environment-specific values — connection strings, wallet paths, credentials — outside the dashboard logic makes this pipeline portable. The same Power BI model can point at a development or production ATP instance simply by changing configuration, without rebuilding any reports.
Designing a Strong Accounts Receivable Data Model
A strong data model is essential for an accurate AR dashboard. The quality of the dashboard depends heavily on how invoice, customer, payment, and date information is structured once it lands in ATP and is imported into Power BI.
Transactional information such as invoice numbers, invoice amounts, outstanding amounts, invoice dates, due dates, and payment status should be organized into fact tables. Supporting information such as customers, currencies, payment terms, business units, and dates belongs in dimension tables. A star-schema approach keeps the model organized and improves performance.
A dedicated Calendar table is also highly recommended, since AR analysis frequently requires date-based reporting — monthly invoice trends, overdue analysis, year-to-date balances, and period comparisons.
The model should avoid unnecessary many-to-many relationships wherever possible, since incorrect relationships can produce duplicate amounts, incorrect invoice counts, and unexpected filter behaviour. Before building visuals, key relationships and calculations should be validated against the original Oracle Fusion figures so the dashboard reflects the source system accurately.
Essential KPIs for an Accounts Receivable Dashboard
A successful AR dashboard focuses on KPIs that directly support collection and cash-flow decisions.
Total Invoice Amount
The overall value of invoices in the selected reporting period — an immediate sense of total invoiced value.
Outstanding Amount
The balance customers still owe. One of the most important KPIs, showing the current receivables position.
Overdue Amount
The portion of outstanding receivables past its due date. A high figure signals collection challenges.
Open Invoices
The number of invoices with an outstanding balance — a sense of collection workload.
Overdue Invoices
Invoices that are both past due and still outstanding — useful for prioritizing follow-up.
Within Due Amount
Outstanding balances still within payment terms — compare with overdue balances for overall health.
Aging Analysis
Outstanding invoices are grouped into buckets so finance teams can see how long receivables have remained unpaid:
Best Visualizations for Accounts Receivable Reporting
AR data can become complex quickly, so choosing the right visualization matters.
- KPI cards for Total Invoice Amount, Outstanding Amount, Overdue Amount, and Open Invoices — for an instant read on the current AR position.
- A bar chart of Aging Bucket vs. Outstanding Amount to show where receivables are concentrated — a large 120+ Days bucket signals where to investigate first.
- A funnel chart of outstanding amounts by Invoice Type to see which invoice categories drive the balance.
- A currency-based chart for organizations operating internationally.
- A bar chart of Customer Name vs. Outstanding Amount to identify and prioritize the highest unpaid balances.
- A comparison of outstanding amounts across Payment Terms to see whether longer credit periods are driving receivables up.
- Line charts of outstanding balances and invoice amounts over time to spot upward or downward trends.
- Slicers for year, invoice date, customer, currency, invoice type, and payment terms so users can filter without leaving the page.
DAX Best Practices for Accounts Receivable Reports
DAX is what converts the raw transactional data brought over from Fusion, through OIC, into ATP, into meaningful financial metrics.
Rather than building a separate calculation for every visual, reusable measures should be created for core KPIs — Total Invoice Amount, Outstanding Amount, Overdue Amount, Open Invoices, Overdue Invoices, and Within Due Amount. Outstanding Amount, for example, should be calculated dynamically so it recalculates automatically as users filter by customer, year, or invoice type.
Aging analysis needs its own calculation logic: the difference between invoice due date and the current date determines overdue days, which are then grouped into the predefined aging buckets.
Variables improve the readability and maintainability of complex DAX formulas by letting an intermediate result be calculated once and reused, instead of repeating the same logic multiple times. The goal is always measures that are reusable, readable, and responsive to Power BI's filter context.
Improving Accounts Receivable Dashboard Performance
Performance matters more as invoice and transaction volumes grow.
It starts with a clean data model — removing unnecessary columns, reviewing relationships, and avoiding duplicate data. Only the fields actually required for reporting should be brought from ATP into the Power BI model; loading unnecessary columns increases model size and slows refresh and query performance.
For large volumes of Oracle Fusion data flowing through OIC into ATP, incremental refresh is worth considering, so Power BI only processes new or recently modified records instead of reprocessing the full history each time.
The number of visuals per page should also be controlled, since a page with too many charts forces Power BI to run many queries at once. A practical structure looks like this:
Overview
High-level KPIs: Total Invoice Amount, Outstanding Amount, Overdue Amount, and Open Invoices.
Aging Analysis
Deeper analysis through aging, customer, currency, invoice type, and payment-term visuals.
Details
Invoice-level detail for users who need to investigate individual transactions.
This gives both executive-level visibility and detailed operational analysis without overcrowding a single page.
Security and Governance for Accounts Receivable Data
AR information contains sensitive customer and financial data, so security needs to be considered end-to-end — not just within Power BI, but across the OIC integration and the ATP wallet-based connection as well.
Power BI Row-Level Security (RLS) can restrict users to the data relevant to their business unit or region. Governance matters equally: consistent naming conventions should be applied to tables, columns, measures, and report pages.
The dashboard should be validated against Oracle Fusion before release to business users — invoice totals, outstanding balances, and overdue amounts should be checked against the source-system reports. This validation catches problems caused by incorrect relationships, missing records, duplicate transactions, or incorrect filter logic, including anything introduced during the OIC extraction step.
Common Mistakes to Avoid in Accounts Receivable Dashboards
- Displaying too many KPIs on the first page instead of focusing on what drives collection decisions.
- Relying on a single metric, such as Outstanding Amount, across every visual instead of pairing it with invoice count, aging, customer, invoice type, currency, and payment terms.
- Incorrect relationships — especially many-to-many — that produce duplicate invoice amounts or incorrect totals.
- Aging buckets sorted alphabetically instead of in logical aging order (e.g., “120+ Days” should not sort before “1–30 Days”).
- Inconsistent currency symbols and display units, which make financial values harder to read at a glance.
- Inconsistent colours, fonts, and visual styles that make the report feel unpolished rather than professional.
Best Practices for Accounts Receivable User Experience
An AR dashboard should be designed around the questions finance users ask every day. The first page should communicate the current receivables position within seconds — outstanding balance, overdue amount, invoice volume, and major collection risks.
Visual hierarchy matters: the most important KPIs at the top, followed by trend and aging analysis, with detailed information further down or on separate pages. Useful slicers include:
Drill-through lets a user select a customer or aging category and move to a detailed invoice page to investigate the underlying transactions. Tooltips add context without cluttering the main view, and conditional formatting highlights overdue balances and aging categories that need attention.
Real Business Use Cases
The Accounts Receivable Dashboard supports several practical finance activities:
- AR Manager — a centralized view of outstanding balances, overdue receivables, aging categories, and customer exposure to prioritize collections.
- Finance Manager — visibility into the overall receivables position and early warning of cash-flow risk.
- CFO — a high-level view of outstanding receivables and overdue exposure to support working-capital decisions.
- Collection Team — customer- and invoice-level analysis to identify and prioritize high-value overdue accounts.
- Finance Analysts — the ability to investigate invoice trends, payment terms, currencies, and aging patterns without manually assembling reports.
Oracle Fusion as the source system, OIC as the integration layer, ATP as the reporting database, and Power BI as the analytics layer together provide a practical way to turn transactional AR data into actionable financial insight.
Conclusion
Building an effective Accounts Receivable Dashboard requires more than connecting data to Power BI and adding charts. It needs a reliable Oracle Fusion data source, an integration layer that can move that data securely and repeatably, a well-designed data model, accurate DAX measures, meaningful KPIs, and a user-friendly dashboard structure.
In this solution, Oracle Fusion provides the underlying AR data, OIC extracts and loads that data into Oracle ATP, and environment-based configuration keeps the connection details manageable across environments. Power BI then transforms this ATP-hosted data into an interactive reporting solution that lets finance teams monitor invoices, outstanding balances, overdue amounts, aging categories, customers, currencies, and payment terms.
By following best practices — a clean data model, reusable DAX measures, validation against Oracle Fusion, performance optimization, appropriate security, and consistent design — organizations can build a reliable AR reporting pipeline that scales with the business.
The value of an Accounts Receivable Dashboard isn't just showing how much money is outstanding. It's helping finance teams understand where the money is, how long it has been outstanding, which customers need attention, and where collection risk is building — moving AR management from manual reporting toward a proactive, data-driven process.